Article by Jennifer Schmitz, Xtrackers Senior Sales Strategist
After years of strong growth for the European ETF market, 2024 started with record flows. In fact, during the first half of the year the industry approached the threshold of 100 billion euros in asset gathering, the second highest on record after 2021.
This success is not only due to institutional clients. The interest in these instruments is also growing enormously among retail investors who increasingly find ETFs a suitable tool to satisfy their investment needs, ranging from standalone investment in highly diversified indices, saving plans and more tactical exposure.
At Xtrackers, the ETF and ETC product suite of DWS, we prioritise empowering investors not only by offering a wide range of products, but also by focusing on training and raising awareness, whether they are beginners or experts.
The availability of our ETFs on Spectrum Markets is part of a strategy that reinforces our commitment to promoting better access to retail investment.
Like Xtrackers, Spectrum Markets also operates across Europe, providing exposure to a broad investor audience. The recent listing launch of our ETFs on their trading venue allows us to cater to local preferences and market dynamics, thereby enhancing the visibility of our products. Spectrum actively supports ETF issuers in enhancing services for retail investors. Through participation in initiatives and leveraging the platform, Xtrackers can offer educational content and innovative trading features. This collaboration is aligned with Xtrackers’ focus on technological advancements and the introduction of thematic ETFs to capitalise on trends such as artificial intelligence and big data, while also ensuring that our ‘Core’ ETFs serve as a solid foundation for diversified portfolios.
Xtrackers is also committed to providing tailored solutions for diversification, such as an ETF dedicated to the Indian market. Making available such specialised ETFs on Spectrum Markets enables European retail investors to access and benefit from the growth potential of India’s economy. This approach resonates with Xtrackers’ mission to empower investors through innovative and diversified investment strategies that cater to both broad market trends and specific opportunities like India.
A breakout moment for India?
India is expected to emerge as a dominant global player with its vibrant investment environment, strong demographics, accelerating urbanization and rising affluence. Investors interested in benefiting from this growth story may consider ETFs, since these financial instruments are logical and simple market access tools that are cost- efficient, liquid and enable a diversified exposure.
Why India?
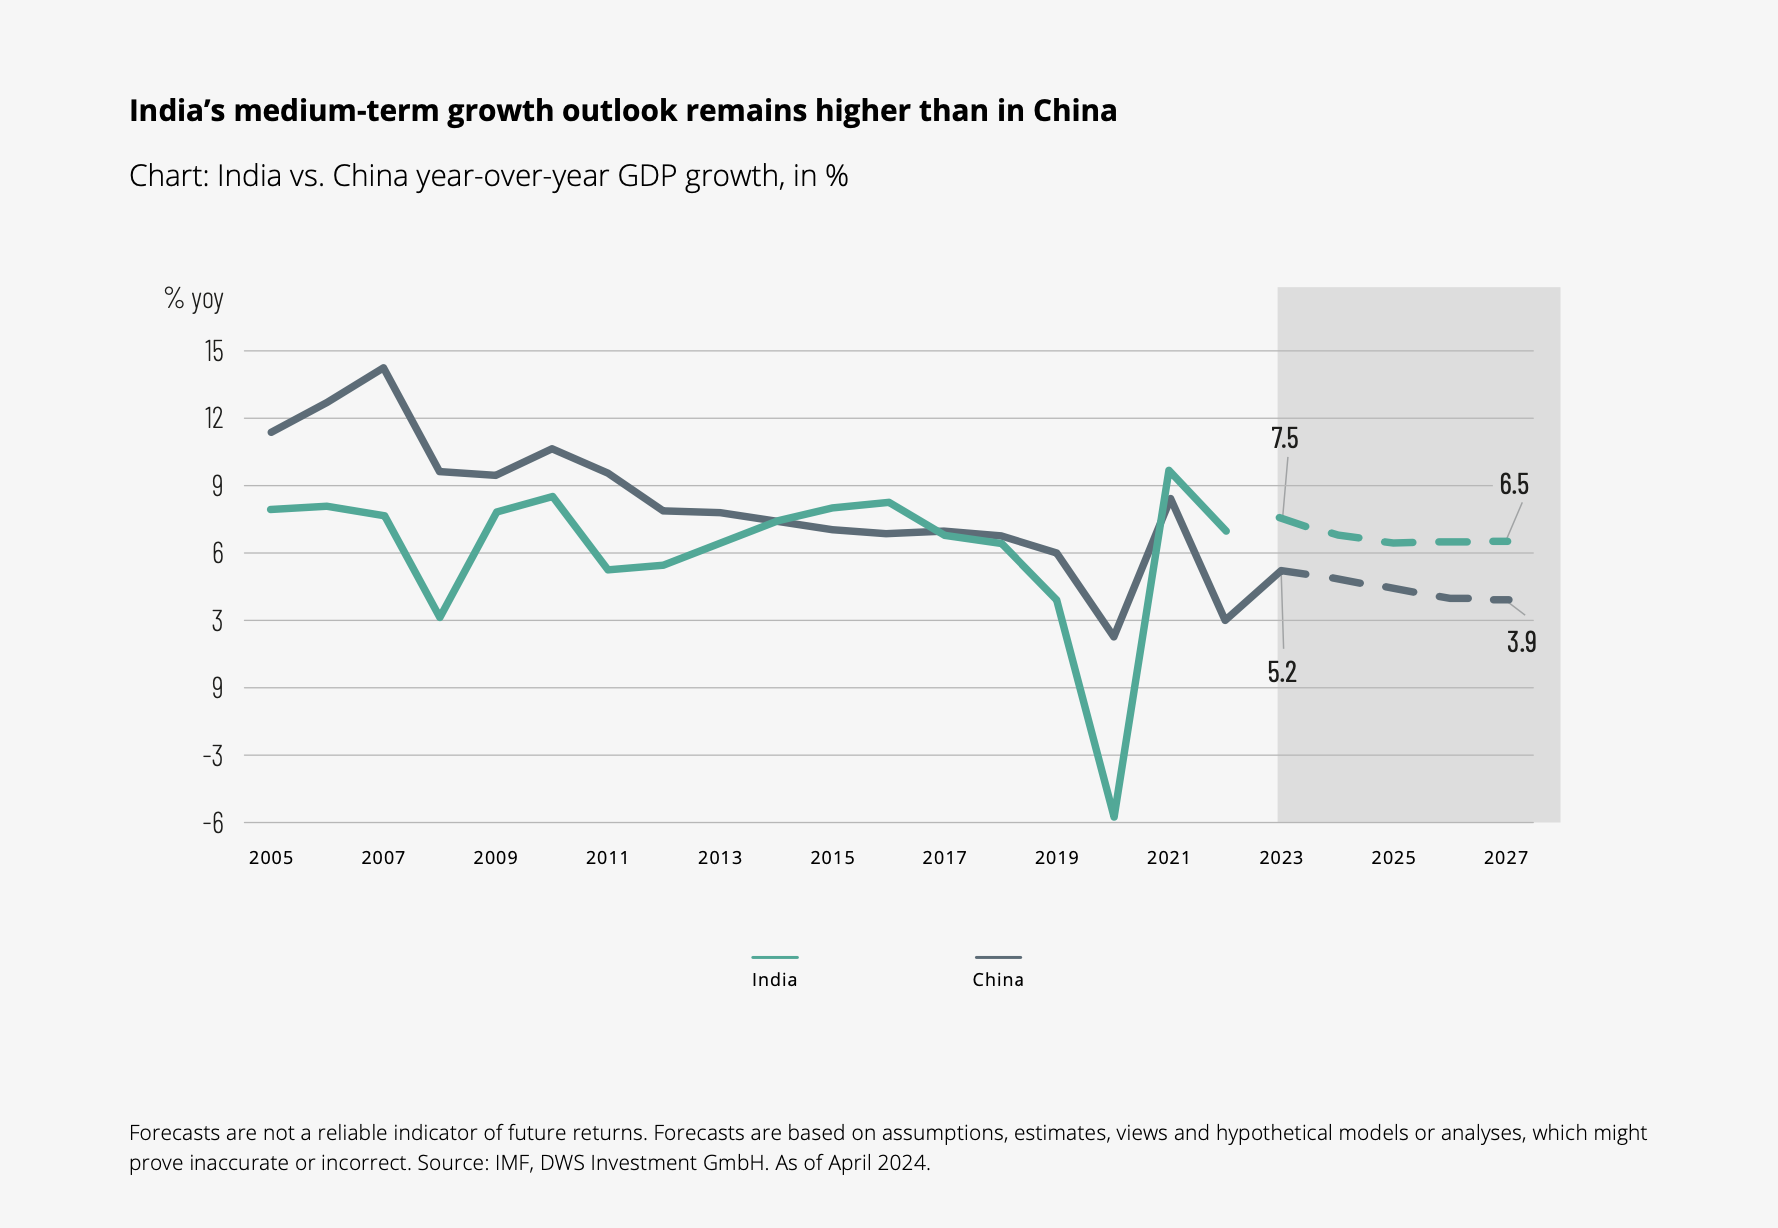
The macroeconomic investment case for India is becoming increasingly compelling. A decade ago, India was part of the “fragile five”, but it has since transformed into a favoured destination for Emerging Market investors. India’s demographic advantages are well recognised, stemming from a combination of the world’s second-largest labour force, with approximately 694 million people (second only to China), and a relatively young population with a median age below 30. This “demographic dividend” could provide a significant boost to what is already the world’s most populous country1. The Indian government’s capital expenditure strategy, growing exports, and the partial liberalisation of the bond market are fueling robust momentum for markets.

Especially India’s strategic focus on digitalisation continues to impact key sectors. Service exports have seen a surge and now cover an array of high-tech services, R&D, analytics, robotic process automation and cloud computing. These reflect 4.5% of global services exports, a significant leap compared to goods exports, which constitute 1.8% of global goods exports. The so-called Global Capability Centers play a pivotal driver of this robust rise in service exports. They have evolved from offering simple call, IT, and back-office services for multinational corporations to providing research and development, process automation, machine learning, and cloud computing2.
On the macro risk side, India’s reliance on oil is declining. While oil remains the key source of energy, efforts are ongoing to diversify its energy sources and enhance energy efficiency. With approximately 85% of India’s oil consumption needs being met through imports, oil however is still the country’s major import. Meanwhile, fiscal policy has become more prudent, and overall rising exports support the improvement in the current account. This positive economic trajectory has not gone unnoticed. In May 2024 S&P Global signaled that it might upgrade India’s credit rating over the intermediate term. For now, the outlook on India has been revised to positive from stable, and the investment grade rating at BBB- has been affirmed3.
Why Indian Equities?
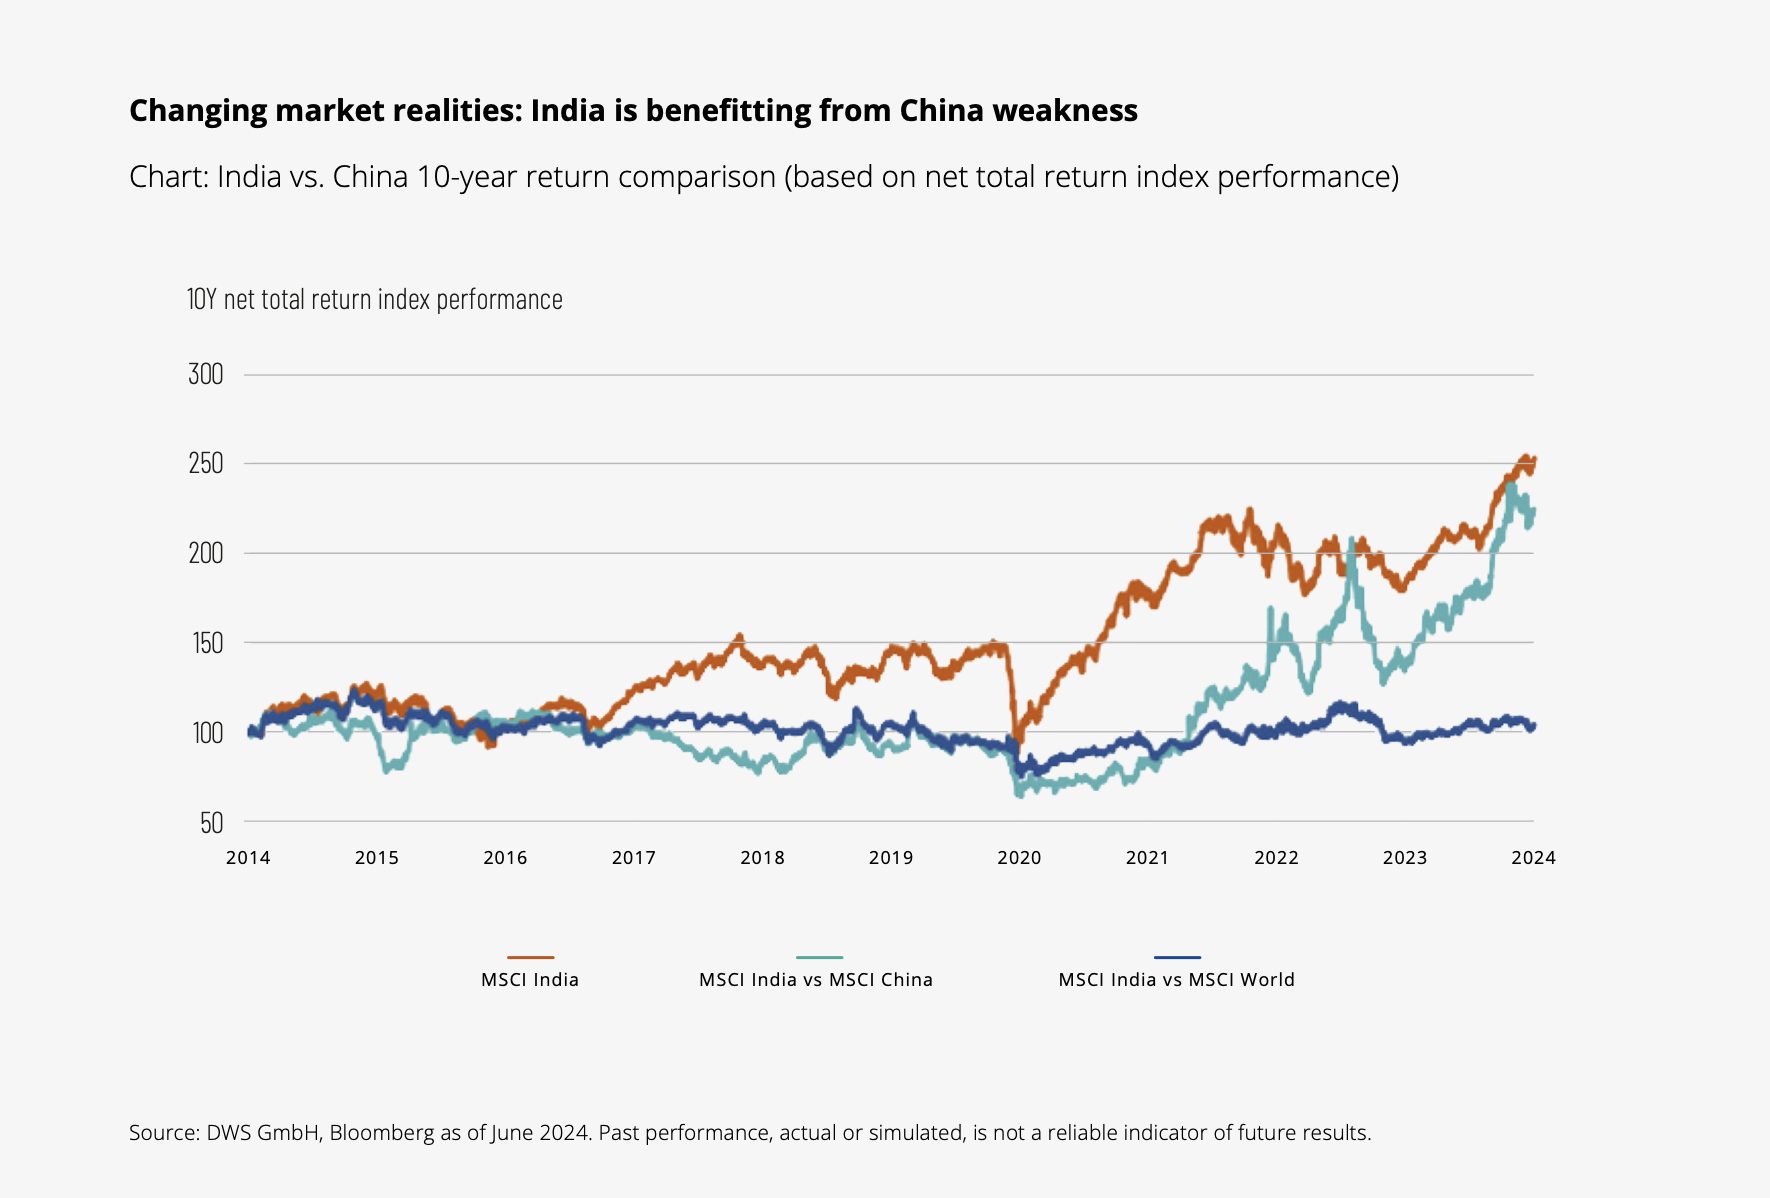
India still appears to be a niche topic for many global investors, but this will likely change over time driven by the simplified market access and its superior growth contribution to global GDP4. The rising economic outlook for India has seen robust association with equity market performance. Over the past three years, the MSCI India Index has gained over 40%, while the MSCI EM Index has lost close to 15% and MSCI China Index has lost more than 45%5. Over the past 10 years, Indian equity markets have outperformed the MSCI EM index by around 7% per year6. This is already impacting allocation realities, as an EM benchmark investor will now find almost 20% of their allocation in India, only trailing China by about 8%, and up from only 8% in 20207.
This is another powerful reminder that broad-based benchmark investing remains sufficiently flexible to adjust to changing long-term trends. More importantly, India is becoming the second country exposure after China that investors may want to manage on a stand-alone basis. When it comes to implementation, investors benefit from a straightforward index landscape, with the Nifty 50 and MSCI India being broadly aligned and closely connected to domestic consumption.

While valuation may not provide an obvious reason to invest in India, the premium to other EMs is in part also a direct consequence of China’s currently low valuation dragging down overall & regional indices. As the major U.S. technology stocks (the so-called Magnificent 7) have recently demonstrated, valuation alone is often a poor indicator of short- to medium-term price trends. If India’s double-digit earnings’ growth continues to develop at an above-average rate and the government’s reform efforts develop greater momentum, we expect India should continue to trade at a premium.
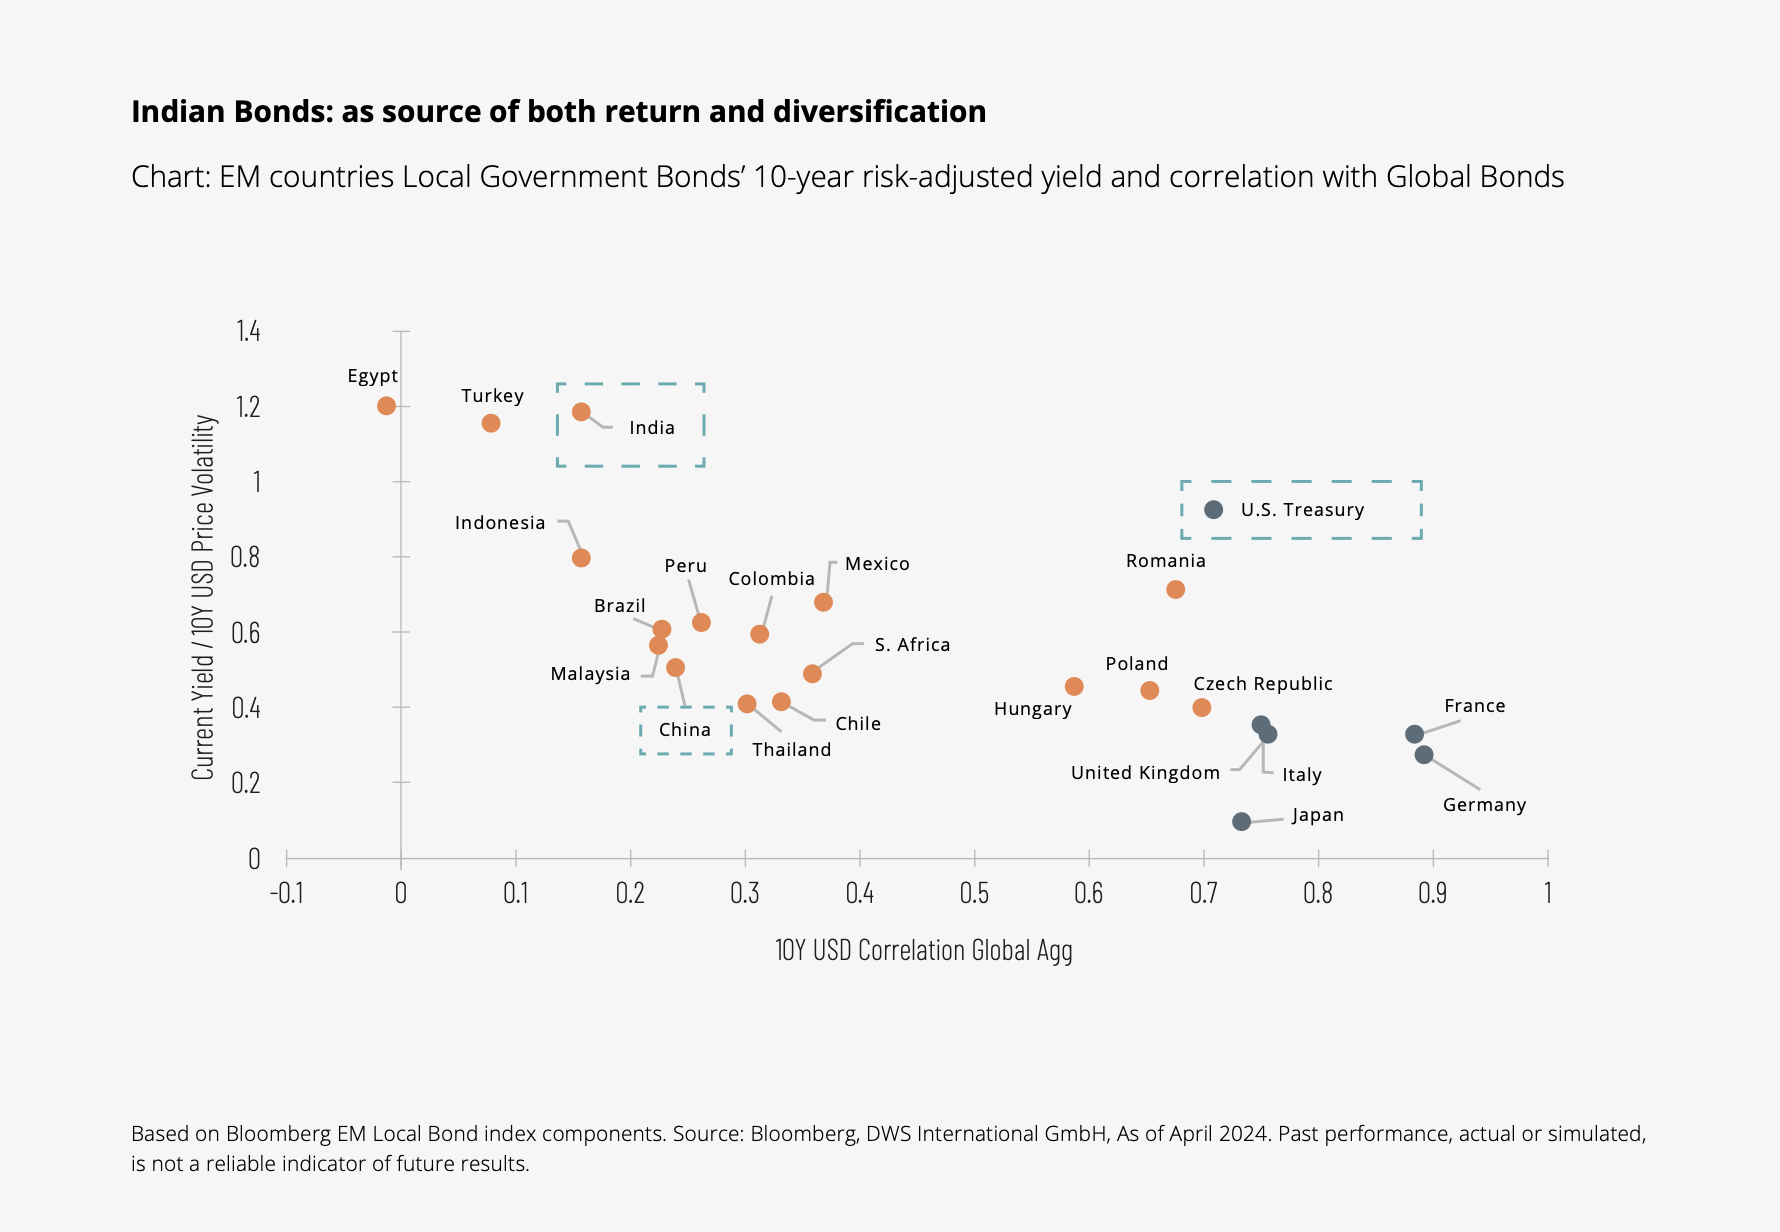
Moreover, India could act as a diversifier in global portfolios since both Indian Equities and Bonds have below- average correlation with the DMs8.
Why Indian Government Bonds?
Market access: India’s weight in EM and global benchmarks is growing
Looking beyond Equities however, the representation of India in portfolios is scarce. With a mere 1% foreign ownership9, the Indian bond market is significantly under-owned by international investors. The inclusion of Indian Fully Accessible Route government bonds into J.P. Morgan’s flagship local government bond indices may change these market dynamics fundamentally. 35 bonds with a combined notional value of about $450 billion have now become eligible and will be phased in over the next ten months at roughly 1% weight per month, up to a maximum weight of 10%. This inclusion is estimated to translate into an influx of foreign capital of over $20 billion. If the inclusion of China into fixed income benchmarks from 2019 onwards, which attracted over $250 billion in foreign portfolio investment, serves as any guide, this might just be the beginning10. In the longer term, India may be included in other major benchmarks.

Furthermore, falling interest rates in the US and Europe could drive more demand again for spread products and EM markets in general.
Why Xtrackers to get exposure to India?
Xtrackers products currently have very competitive Total Expense Ratios (TERs) for both bond and equity UCITs products. Furthermore, India is one of the few remaining equity markets in which synthetic replication may have advantages over physical replication due to more predictable and transparent access costs11.
1. Source: DWS Investment GmbH: Investing-in-India-Bridging-the-allocation-gap-with-passive-market-access.pdf (dws.com) , As of: July 2024. UN DESA Policy Brief No. 153: India overtakes China as the world’s most populous country | Department of Economic and Social Affairs.
2. Source: DWS Macro Research, Reserve Bank of India - RBI Bulletin What Drives India’s Services Exports?, June 2024.
3. Source: India Outlook Revised To Positive On Robust Growth | S&P Global Ratings (spglobal.com). As of: May 29th, 2024
4. Source: IMF, Spark Research. As of: Oct 2023. Note: The charts are based on actual GDP data as available in Oct 2023 and use forecasted GDP thereafter. Forecasts are not a reliable indicator of future performance. Forecasts are based on assumptions, estimates, views and hypothetical models or analyses, which might prove inaccurate or incorrect.
5. Source: Bloomberg, based on net total return indices, 07/1994 – 07/2024 and 05/2021 – 05/2024, respectively. Past performance, actual or simulated, is not a reliable indication of future performance.
6. Source: DWS Investment GmbH, Bloomberg L.P. As of: March 2024.
7. Source: Source: DWS, MSCI, June 2024.
8. Source: DWS Investment GmbH. As of: June 2024
9. Source: Reserve Bank of India as of April 2024.
10. Source: DWS International GmbH, J.P. Morgan estimates as of April 2024. China data is inclusive of all local currency bonds including CGBS, FBs and NCDs.
11. Swap rates are published on the Xtrackers website and locked in for 12-months with Swap counterparties. Physical funds may incur capital gains taxes that are not always known in advance to all investors. Source: DWS Investment GmbH, Bloomberg L.P. As of: March 2024.
Key Risk Factors – Xtrackers India Government Bond UCITS ETF
The value of your investment may go down as well as up and past performance does not predict future returns. Investor capital may be at risk up to a total loss.
The Fund is exposed to less economically developed economies (known as emerging markets) which involve greater risks than well developed economies. Political unrest and economic downturn may be more likely and will affect the value of your investment.
The Fund may have exposure to a small number of investments or have exposure to a few countries, industries, sectors of the economy or issuers. This can make the share price of the Fund fluctuate significantly.
The Fund is exposed to market movements in a single country or region which may be adversely affected by political or economic developments, government action or natural events that do not affect a fund investing in broader markets.
Bonds are exposed to credit risk and interest rate risk. There is a risk that the bond issuer may be unable to pay interest or repay the bond principal, resulting in your investment suffering a loss. If interest rates rise, typically the value of the bond will fall, which could also affect the value of your investment.
Key Risk Factors - Xtrackers MSCI India Swap UCITS ETF/ Nifty 50 Swap Ucits ETF
The value of your investment may go down as well as up and past performance does not predict future returns. Investor capital may be at risk up to a total loss.
The Fund is exposed to less economically developed economies (known as emerging markets) which involve greater risks than well developed economies. Political unrest and economic downturn may be more likely and will affect the value of your investment.
The value of an investment in shares will depend on a number of factors including, but not limited to, market and economic conditions, sector, geographical region and political events.
The Fund is exposed to market movements in a single country or region which may be adversely affected by political or economic developments, government action or natural events that do not affect a fund investing in broader markets.
The Fund will enter into a derivative with a counterparty. If the counterparty fails to make payments (for example, it becomes insolvent) this may result in your investment suffering a loss. DISCLAIMER
This marketing communication is intended for professional clients only. Please read the fund prospectus and KID before making a final investment decision.
The above article and the opinions and ideas presented therein are solely those of the author and do not necessarily reflect those of Spectrum Markets. Spectrum Markets shall not be held liable for any inaccuracies, misinformation or other information provided by the author. Nothing herein constitutes an offer to sell or a solicitation of an offer to purchase any financial instruments listed on Spectrum Markets or any product described herein. Spectrum Markets does not provide financial services, such as investment advice or investment brokerage. Prospective retail investors can trade such products only with their brokers. The information herein does not constitute investment advice or an investment recommendation. Any information provided does not have regard to the specific investment objectives, financial situation and needs of any specific person who may receive it.


